
(27 August 2026) It is now 10 pm MST August 27, or, 4 AM GMT, August 27. We have been watching events centered on Iran and its regime, waiting for escalation of what looks to be the Second Signpost.
We have been watching since February 28. The Strait of Hormuz was mostly closed from March 2 to August 23 or so, being about 175 days. The Strait is sporadically open, and is under the control of the Iranian regime.
We can more clearly estimate how much oil was removed from the global energy system with the help of this bar graph available on the US government EIA site.
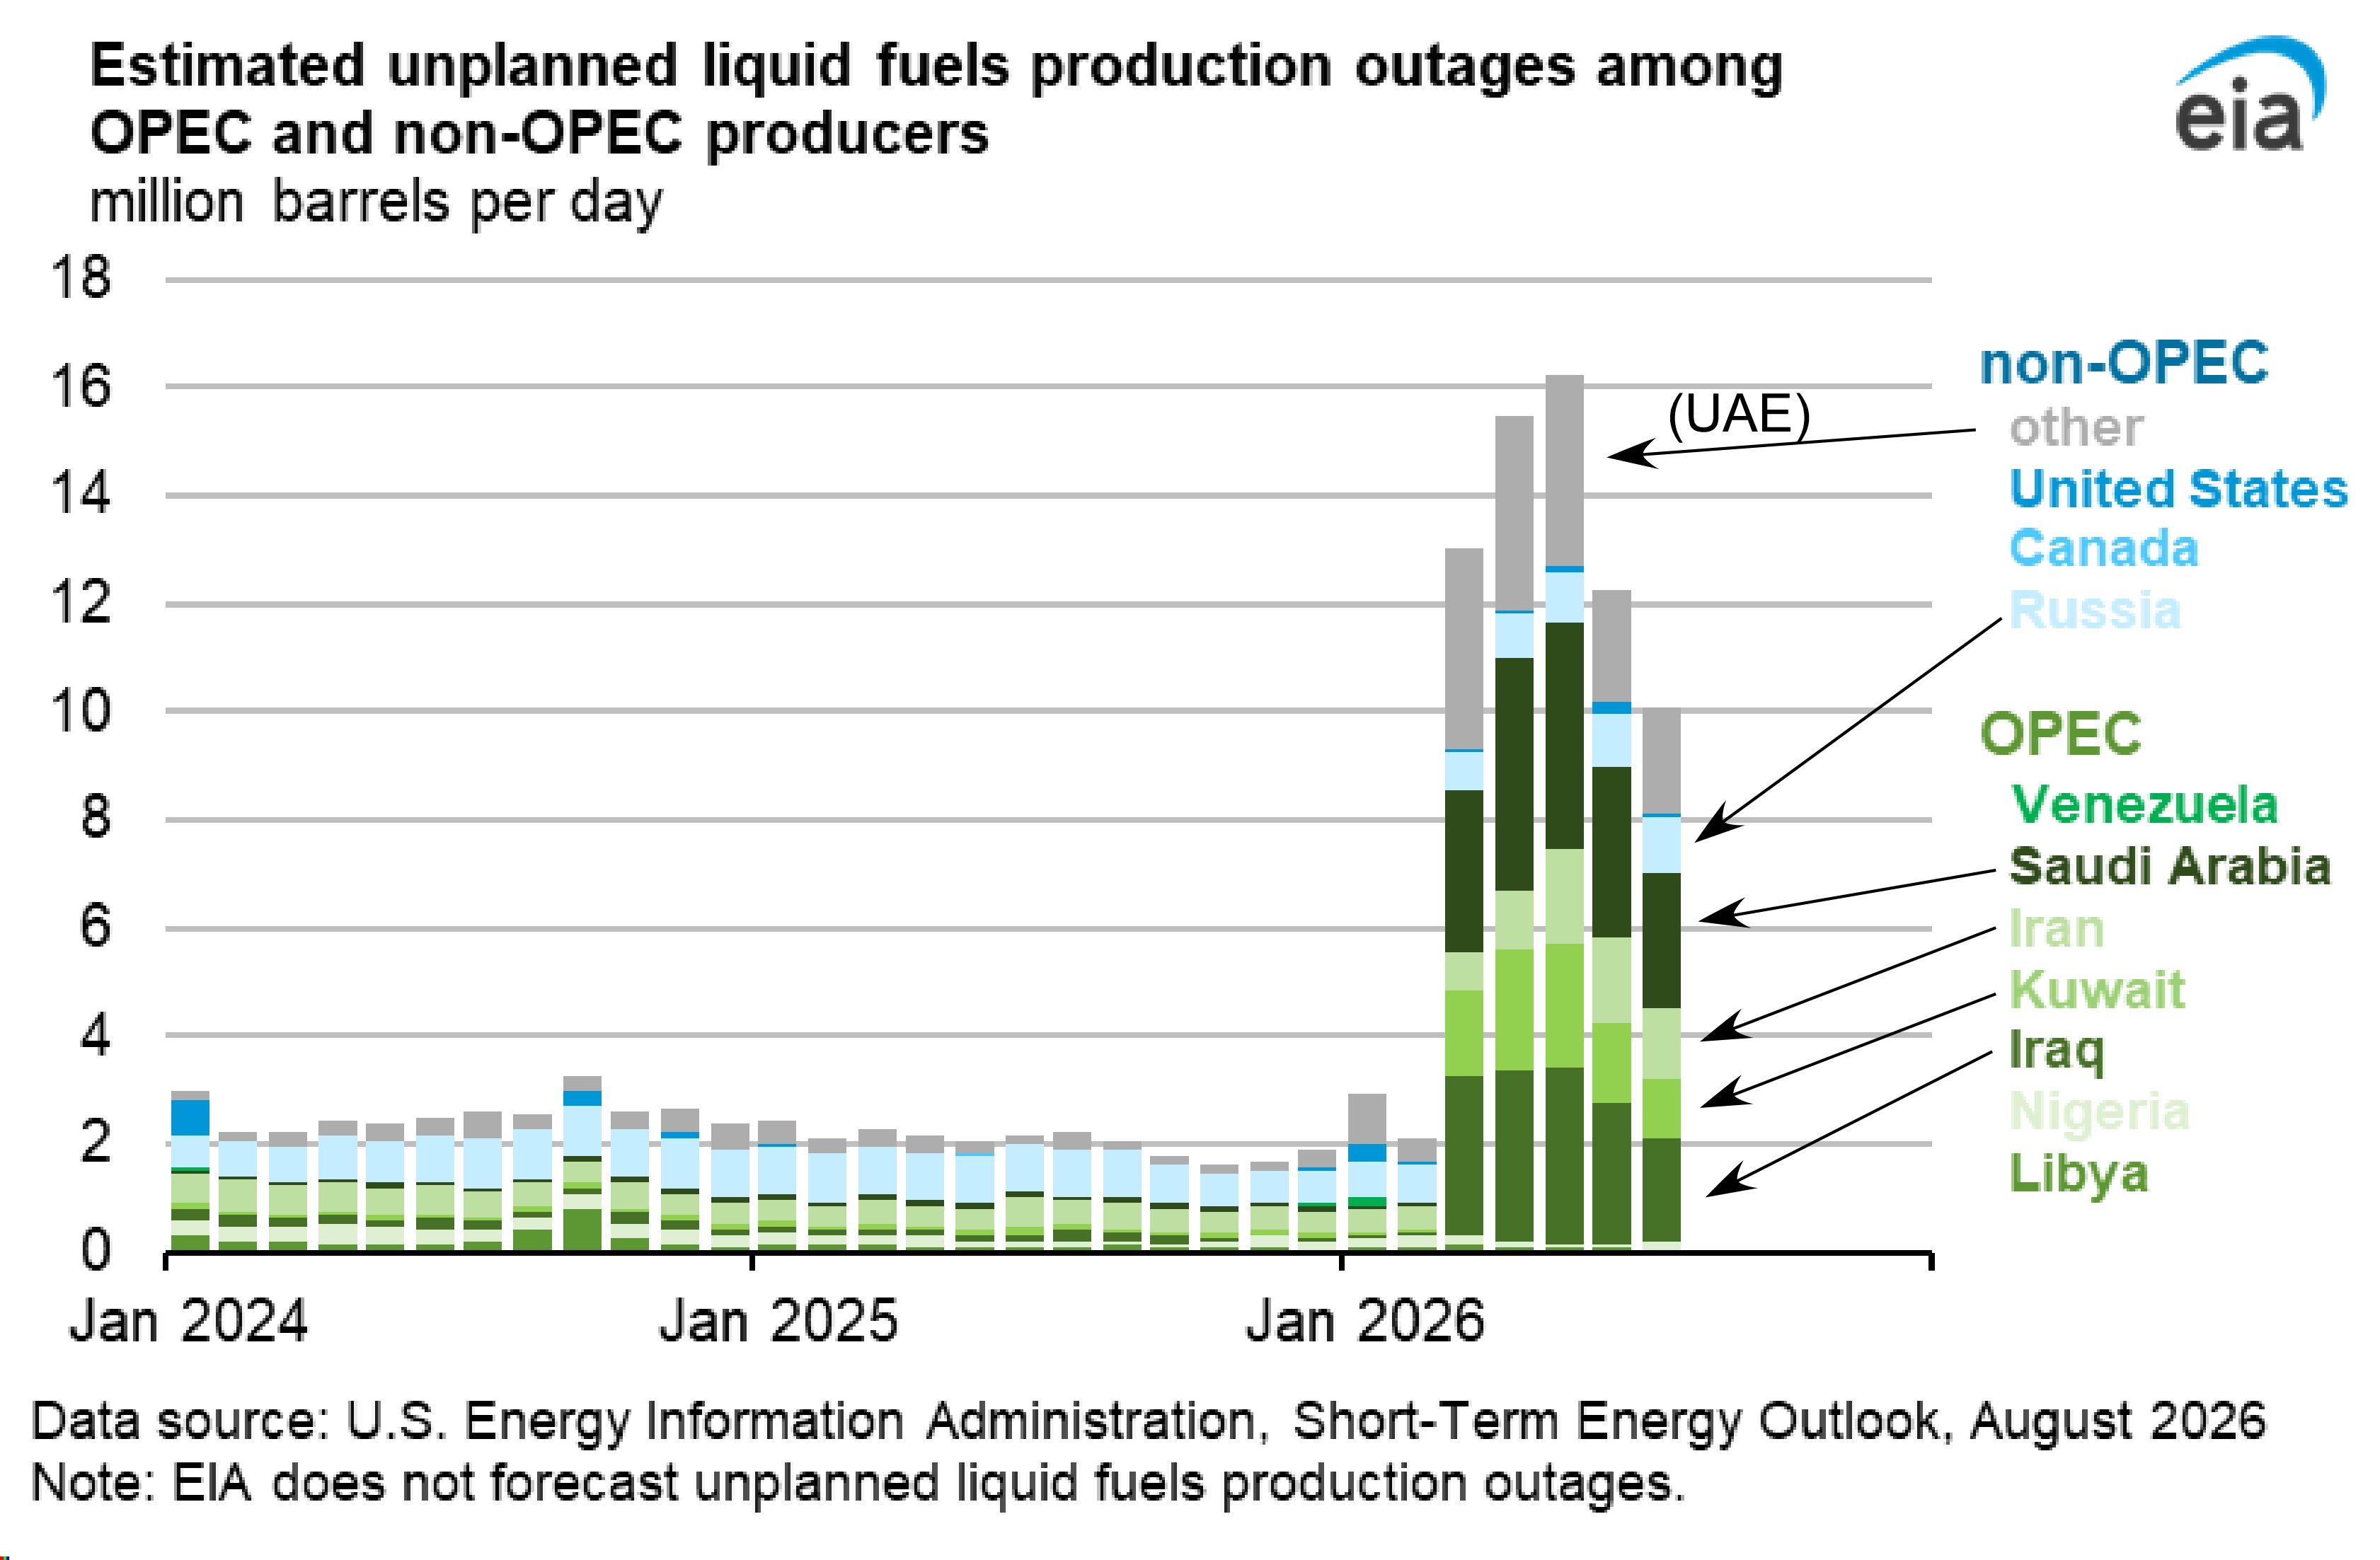
EIA Estimates of Unplanned Cuts in Oil Production, March to July 2026.
It shows that at any time prior to the war it was typical for 2 million barrels per day production to be offline.
These numbers are production cuts, not necessarily that which could not go through the Strait of Hormuz, though most of the production loss was indeed due to the Iran War. Production losses due to the war started around February 28.
March’s shortage was 10 million barrels per day (bpd), or 300 million barrels total.
April saw 13 million bpd lost, or 390 million barrels.
May saw 14 million bpd lost, or 420 million barrels.
June saw 10 million bpd lost, or 300 million barrels.
Finally, July saw 8 million bpd lost, or 240 million barrels.
The total for the five months comes to 1.65 billion barrels of oil lost.
That amount not only would empty the 1.2 billion barrel inventory globally, but start chipping away at China’s 1.4 billion barrel storage.
Conclusion
This bar graph from the EIA shows more clearly the oil production that was lost. It shows the amount lost by each of the five major Middle East producers: Iran, Iraq, Kuwait, Saudi Arabia, and the UAE. None of this includes the loss of all the liquid natural gas and fertilizers by Qatar.
The world is indeed scraping the bottom of its stored oil (except for China).
Keep watch.
Categories: In The News, Signpost #2: Iran, World in the End Times
 THE FOUR SIGNPOSTS
Many of the current negative trends influence and even strengthen one another.
Here is a new one, an interaction between El Nino and the fuel price/shortage:
Many tankers from and to Asia, who used to sail to the Persian Gulf, now have to go through the Panama Canal to US oil production and refining facilities in the Gulf of Mexico. Tankers pay for each passage, and who pays most is let through first.
The Panama canal has many locks and depends on the availability of natural water to stay wet. The current El Nino is already causing extreme drought in Middle America, so the Panama Channel authority will reduce the number of passages from the normal 40 to 34 a day on September 3rd. It may get lower if the drought continues, which is to be expected.
So El Nino now has the same role as the Houthi’s. Their attacks on ships in Strait Bab el Mandeb force some ships to go all the way around Africa: a lot slower and more expensive. Now El Nino is forcing some ships to go all the way around South America. Also much slower and more expensive again.
A Korean LPG gas tanker has just paid 5.3 million dollars for passage on September 1st, to avoid rounding Cape Horn. A new record price that is way above the previous record of 4 million dollars.
https://www.bnr.nl/nieuws/economie/10609145/tanker-betaalt-recordbedrag-van-5-3-miljoen-dollar-voor-doorvaart-panamakanaal
Adamant,
Great dot connecting.
Just now I encountered another dot in the the Wall Street Journal. Excerpt:
Food crisis is coming due to the triple whammy of:
A. Iran’s disruption of the Strait of Hormuz interferes with petroleum movement and 30% of global nitrogen fertiliser production.
B. Russia was a leading fertiliser exporter before the Ukraine war:
– 23 percent of global ammonia
– 14 percent of global urea
– 40 percent of global potash (together with Belarus)
But Russia’s domestic needs have taken priority amid the Ukraine war, so they have been exporting less.
With Ukraine paralysing Russia’s refineries etc these latest months, it is to be expected Russia will export less fertiliser still.
C. China, a major fertiliser user, also has long been the world’s second-largest exporter of fertiliser. But over the past year, China too has begun to pull back on exports:
– Beginning late last year, exports of phosphate fertilisers were suspended
– In March restrictions on additional fertiliser varieties were broadened
– In May most sulphuric-acid exports were halted
Much of the world’s sulphur is recovered as a byproduct of oil refining and natural-gas processing. It is then converted into sulphuric acid, which reacts with mined phosphate rock to produce phosphoric acid used to make phosphate fertilisers.
Taken together, the Chinese suspensions and restrictions have likely affected as much as 40 million metric tons of their fertiliser exports. Largely because of disruptions to petroleum production and sulphur shipments through the Strait of Hormuz, sulphur prices have increased substantially. China’s continued uptake of sulphur while banning fertiliser exports has contributed to a doubling of sulphur prices this year alone.
Sources:
https://www.wsj.com/opinion/a-food-crisis-may-be-coming-to-the-u-s-01026585
https://carnegieendowment.org/russia-eurasia/politika/2026/03/russia-new-fertilizer-export
On this blog, we all know about point A, and about El Nino’s adverse effects on the world’s food, and about the important Ukrainian food exports recently having been stymied by Russia.
But B and C, about Russia and China’s roles in fertilisers, are eye-openers to me.
It looks like the food crisis will be worse again.
But China made sure it will be immune to the fertiliser crunch, and will only be at the mercy of El Nino.